


Twelve months ago I took over two AWS accounts, production and staging, which together cost around 15,000 euros a month. Today the same accounts cost around 2,500 euros. The same applications are running, for the same users, with no compromise on production availability. Nothing was switched off that anyone missed.
All figures in this article are rounded net amounts excluding VAT, converted from the invoiced US dollar amounts at the exchange rate of the respective month; commitments are shown amortized. What that means, and why it matters, comes further down.
This article describes how the 12,500 euro difference came about. Not as a success story but as a guide: which order works, which tools you actually need, where the large amounts were, and where I wasted time. It is written for developers and decision makers looking at an AWS bill that nobody can explain any more.
If you want the result, starting point and approach in project format first, see the concise FinOps case study: AWS costs from €15,000 to €2,500.
The same twelve months also exist as a paper, ordered along the FinOps Framework and with the SQL queries in full: Usage Before Rate (PDF, 15 pages). This article tells what happened; the paper argues the sequence.
Two things up front. First: there was no single big mistake. No forgotten Kubernetes cluster, no crypto miner, no database running in triplicate. The bill was high for the same reasons most AWS bills are high: four years of growth in which there was always something more important than looking at cost.
Second, and this is what may make the case more interesting than the usual reports: there was hardly any classic EC2 fleet. The bill consisted almost entirely of managed services, namely RDS, DynamoDB, ECS on Fargate, S3, CloudWatch and Athena. If you believe that serverless and managed services make the cost question go away, here is the counterexample. All that changes is where the money leaks: no longer into oversized instances, but into data volumes, query patterns and observability.
This is what the twelve months looked like:
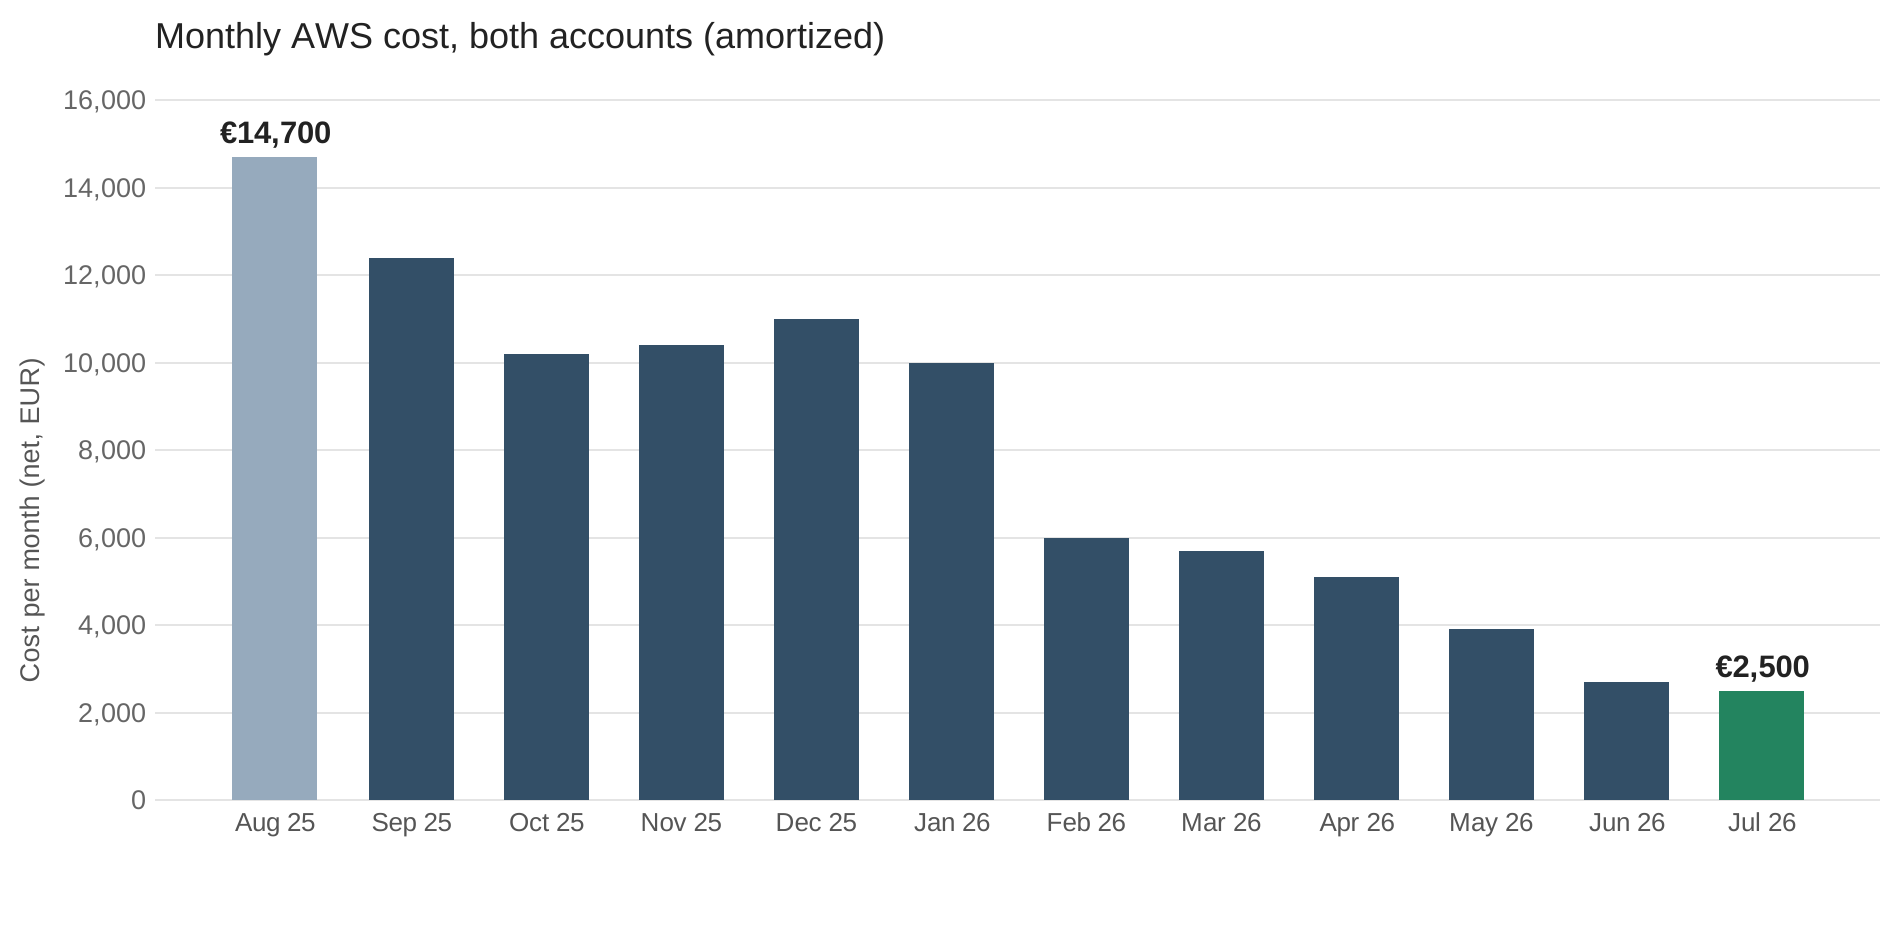
The starting point: nobody had done anything wrong
The system had grown over years. Different developers, different priorities, different years with different AWS fashions. Every single decision had been defensible at the time it was made: task sizes were generous because an outage would have cost more than the markup. Metrics were recorded with every dimension anyone had once thought useful. Data was kept because nobody had ever decided how long it was needed.
That is the normal case. AWS bills rarely explode. They sediment.
I think this point matters because it determines the approach. Looking for the one culprit, the one colleague, the one bad decision, means looking past the problem. There is no such thing. There are only hundreds of small decisions that were individually reasonable and together cost 15,000 euros a month. That also has a pleasant consequence: cost work does not have to expose anyone. It clears away what accumulates by nature.
Expectations in the team were set accordingly: people assumed maybe ten or fifteen per cent was in there. A bit of tidying, a few reservations, done. Nobody would have signed off on more than 80 per cent at the start, myself included.
Week one: measure before touching anything
The first reflex with high AWS costs is to open Cost Explorer and go after the biggest line items. Cost Explorer is good for an overview, but it has one decisive weakness: it aggregates. "CloudWatch: 2,600 euros" is not information you can work with. Behind it sit metrics, logs, dashboards and alarms, all things with completely different causes and remedies.
The tool you actually need is AWS Data Exports with the Cost and Usage Report 2.0: the complete raw billing data, every single usage line, exported to S3 and queryable with Athena. When you create the export, include resource IDs. That is the part many people forget, and it is what later gives you the line_item_resource_id column that makes the difference. Setup takes an hour, and from then on you answer cost questions with SQL instead of guesses.
A side note with some irony: Athena shows up later in this report as one of the largest cost items. That is not a contradiction. The expensive Athena cost came from application usage that scanned terabytes month after month. The cost analysis queries here cost cents. The difference is not the tool, it is the amount of data per query, a theme that will come up again.
The first query I run on any account groups not by service but by usage type:
SELECT
  line_item_product_code,
  line_item_usage_type,
  ROUND(SUM(line_item_unblended_cost), 2) AS cost
FROM cur
WHERE line_item_usage_start_date >= DATE '2025-08-01'
  AND line_item_usage_start_date <  DATE '2025-09-01'
GROUP BY 1, 2
ORDER BY cost DESC
LIMIT 50;
The result of that query determined the work of the following months. The surprise was not that databases cost money, they always do. The surprise was that observability and analytics had caught up with the databases: CloudWatch and Athena together accounted for more money than RDS. Two items that appear in no architecture diagram as a cost centre, because they just run alongside everything else.
When a usage type stands out, the second query follows: the same line, resolved by resource. That needs resource IDs in the export, hence the note above.
SELECT
  line_item_resource_id,
  ROUND(SUM(line_item_unblended_cost), 2) AS cost
FROM cur
WHERE line_item_product_code = 'AmazonCloudWatch'
  AND line_item_usage_start_date >= DATE '2025-08-01'
GROUP BY 1
ORDER BY cost DESC
LIMIT 50;
With those two queries, first usage type then resource, almost any cost question can be answered in minutes. The analysis produced a list of a good thirty items, each with three figures: estimated saving per month, effort in days, risk to operations. That list is the actual working document. Everything else is working through it in the right order.
Three measurement traps that can cost weeks
Before the measures, three things about the numbers themselves. Each of them has cost me time in earlier projects until I understood it.
Unblended, blended, amortized: there is no such thing as "the" cost. The CUR provides several cost columns and they answer different questions. Unblended cost shows non-amortized usage cost, good for the question of what was charged in a given month. As soon as Reserved Instances or Savings Plans are involved, I also use the amortized view for comparisons, so that upfront payments and recurring reservation fees are spread across their term. This project provides the best example of that itself: after the database reservations were bought, the RDS line in the unblended view dropped to a fraction. Reading that as "the databases are nearly free now" is measuring wrong. Only the amortized view shows the real running cost. And if you want to evaluate measures, you also have to strip out one-off effects: a data export for a migration is an event, not a trend.
Credits, discounts and tax distort the picture. Startup credits, contractual discounts or credits from support cases show up as negative items, with VAT as its own line on top. Anyone reading the success of a measure off the invoice total while credits expired in the same month is measuring noise. The same goes for the exchange rate: AWS bills in US dollars, so a euro comparison between two months moves even when nothing about usage changed. So: measure usage, meaning hours, gigabytes, terabytes scanned and requests, not just euros. Usage does not lie. And all figures in this article are net, because you do not optimize tax away.
Month-on-month comparison needs context. February is ten per cent shorter than January. A month with a marketing campaign is no benchmark for one without. So I compare weekly averages against weekly averages, always together with a business unit of measure, more on that later.
This sounds pedantic, but it decides whether the project builds trust or loses it. The first number that turns out to be wrong costs more credibility than three correct ones can rebuild.
The right order, and why commitments come last
Order is where most cost projects go wrong. It is:
- Delete and cap retention for whatever nobody needs
- Review observability: logs, metrics, trails, the running costs of operations
- Get data under control: storage classes, data volumes, query patterns
- Shrink whatever is oversized
- Change architecture where it burns money
- Only at the very end: commitments, meaning reservations and Savings Plans
The most common mistake is starting with point 6, because it is the most convenient: no code change, no risk, a few clicks, a decent discount. But a commitment is a promise to AWS to pay for a certain amount of capacity for one to three years, whether you use it or not. Committing to a bloated infrastructure cements the waste and makes every later optimization economically pointless: the downsized database then saves nothing, because the old size has already been paid for.
In this project, a commitment on the initial state would have locked in the database and compute load of that time for one to three years, a multiple of what was actually needed after the cleanup. Put differently: the most convenient first step would have ended the project before it began.
There is a second reason for this order, and it is psychological. The early phases consist of measures with immediately visible results and practically no risk. That is exactly how you earn the trust you will need later for the phases that touch running systems. Start with the riskiest rebuild and stumble, and you get no backing for the rest.
Phase 1: deleting and retention. The unglamorous part
The first weeks consisted almost entirely of tidying up, and little in the twelve months had a better ratio of effort to saving.
What had accumulated:
- CloudWatch log groups without retention. Log groups that had kept every byte for years. A retention policy of 30 to 90 days is one line of Terraform.
- Snapshots and backups far beyond any recovery requirement. Backup automation that diligently creates and never cleans up.
- Data left over from finished projects. Exports, raw import data, intermediate states: data whose only job for years had been to cost money.
The command that finds money on almost any grown account straight away:
# Log groups without a retention rule
aws logs describe-log-groups \
  --query 'logGroups[?!retentionInDays].[logGroupName,storedBytes]' \
  --output table
The most important rule in this phase is not technical but organizational: never delete anything irreversibly straight away. First stop it, archive it or take a snapshot, then wait two weeks to see if anyone shouts, then delete. In twelve months exactly one person shouted, and restoring took twenty minutes. That rule is why tidying up can be done without fear.
It is also the answer to the objection that is guaranteed to come up in this phase: "how do you know nobody needs that?" I do not know. I do not need to know. I only need a way to correct a mistake in twenty minutes rather than in a crisis meeting. Stopping is reversible. Debating whether something might theoretically still be needed is not: it only costs weeks in which the resource keeps burning money.
Result for the phase: around 1,200 euros a month, at practically zero risk.
Phase 2: observability, when measuring cost more than what was measured
The most revealing single finding of the project sat in CloudWatch, and it will look familiar to anyone running custom metrics with dimensions: every unique combination of metric name and dimension values is a separate metric to AWS, and is billed separately.
That sounds harmless until you put high-cardinality values into dimensions. A metric "processing time" is one metric. The same metric with a dimension "customer" is as many metrics as you have customers. Add a second dimension, container ID, job type, version, and it multiplies. A handful of well-meant measurement points becomes tens of thousands of billed metrics, and nobody ever made a decision that felt wrong. Every single dimension was a good idea at the time it was introduced.
Here CloudWatch was temporarily the second largest item on the entire bill, peaking in December, more expensive than the databases whose behaviour it was supposed to watch. Observability that costs more than the thing observed is no longer observability. It is a leak.
The approach:
- Count metrics, do not estimate them. An evaluation of which custom namespaces contain how many metrics, and which of those were read by any alarm or dashboard in the last 90 days. The result is almost always the same: most are written and never read.
- High-cardinality values out of dimensions. IDs belong in structured logs, where you query them with Logs Insights when needed, not in metric dimensions, where every distinct value costs money permanently. The rule of thumb: dimensions answer "how is the system doing", logs answer "what happened with customer X".
- Aggregate what belongs together. Where measurement was per individual instance, the sum or a percentile across the group is almost always enough.
The order of checks matters: first find out which metrics are referenced in alarms and dashboards, then cut. A deleted metric with a production alarm attached is exactly the outage this project cannot afford.
Result for the phase: around 1,800 euros a month.
Phase 3: data. Storing, querying, throwing away
The largest single block of the project. It consisted of two stories with the same root: too much data, kept too long, queried too broadly.
Athena: the price of the full scan. Athena bills per terabyte scanned. That is a fair model as long as queries only read what they need. The data here was unpartitioned: every query, however small its question, scanned the entire dataset. And the dataset grew every day. The result was an item of around 2,500 euros a month, for queries whose answers sat in a fraction of the data.
The fix had two parts. First, partitioning, in this case by date: a query about the last week then reads only the last week, not four years. Second, and this was the more uncomfortable part, the question of why the dataset was so large in the first place. The answer: no reason. A substantial share of the data was no longer needed for a single report and could be deleted. Less data means less scanning, less storage, less of everything. Switching to a columnar format such as Parquet amplifies the effect considerably. But the order is: throw away first, then partition, then worry about formats.
S3: retention is a decision, not a default. The second story mainly concerned the staging environment. It was never superfluous, it is needed for every test. But its data was treated like production data: kept as though something depended on it. It does not. Test data is consumable. Today aggressive lifecycle rules apply there and data is deleted after a short time. The effect only became fully visible in early summer, because the retention questions had to be settled first: what does the business actually need, what does a legal retention duty require, and what is merely habit. Settling that takes longer than the Terraform line afterwards, and it is the real core of the measure.
On top came the usual moves: S3 Storage Lens and access logging for two weeks to see read patterns before writing rules. Lifecycle rules for everything with a clear pattern. Deleting aborted multipart uploads after seven days, an invisible item almost everyone has: the fragments show up in no bucket listing but cost storage like whole objects. Intelligent-Tiering specifically for data with unknown or changing access patterns, after weighing object sizes and monitoring cost, because objects below 128 KB are not monitored at all and stay permanently in the most expensive storage class. And RDS backup retention back to a level that matches an actual recovery requirement.
Result for the phase: around 4,000 euros a month, the largest single block of the project. And the saving is permanent, because it does not rest on a discount but on work disappearing that nobody ever needed.
Phase 4: compute, sized against fear
Only now compute capacity. Not earlier, because after phases 1 to 3 it was clear what load actually remains. Applying rightsizing to workloads whose cause is being optimized away is wasted diligence.
The pattern with the ECS services was the same one I know from EC2 fleets: sized against fear, not against load. Task sizes whose CPU and memory reservations were used at a fraction on a weekly average. Capacity for a load case that occurs twice a year, held around the clock.
I understand that fear. Size a task too small and cause an outage, and you have a conversation ahead of you. Make it twice as large as needed and you have none, because the cost does not stand out to anyone. All the incentives point towards oversizing. That is exactly why rightsizing only works with data that replaces the fear.
Concretely:
- Task sizes based on 14 day metrics, not on gut feeling. Container Insights gives actual utilization per service, and the right reservation follows from it, usually one or two steps smaller. The sequence matters: one step down, observe for a week, then the next. Jumping to a quarter in one step produces the outage that discredits the whole project.
- Lambda memory measured, not guessed. With Lambda the memory setting also determines CPU, and billing is in GB-seconds. That means more memory pays off exactly when runtime falls disproportionately to the memory increase. Several functions here became so much faster with more memory that total cost fell despite the higher allocation, while for others the old setting was already optimal. Lambda Power Tuning is a ready-made open source tool that measures exactly this curve per function. Half an hour per function instead of guessing.
- Fargate Spot for anything interruptible. Batch processing and similar jobs tolerate a two minute warning and an abort, provided they checkpoint and can resume, and there is a substantial discount for it. Where that was not the case, regular capacity stayed. Forcing Spot onto systems that cannot tolerate interruption is not cost optimization, it is a deferred outage.
Result for the phase: around 2,000 euros a month. Time-consuming, because every change wants observing.
Phase 5: architecture, where the bill is a symptom
Beyond a certain point, high cost is no longer a configuration problem but an architecture problem. Three examples from this project:
The staging environment ran around the clock. Used on weekdays between 9 and 18, which is 45 of 168 weekly hours, so 73 per cent of its runtime was unused. A scheduler that shuts the environment down in the evening and brings it up in the morning is an afternoon of work: scale ECS services to zero, stop RDS instances, reverse in the morning, driven by EventBridge Scheduler. In this setup the morning start typically took around ten minutes, so the scheduler runs before the working day. The initial objections to switching things off disappeared after the first week. Nobody ever asked about it again.
The same expensive query ran hundreds of times a minute. Part of the database load consisted of identical read queries whose result rarely changed. A cache in front took exactly that load off the database. In this respect caching is not a performance measure but a cost measure: the cheapest query is the one that never reaches the database.
Polling was replaced by events. Processes asking every minute whether there was anything to do created baseline load around the clock. Event driven triggering via EventBridge and SQS means compute only when something actually happens. For loads that arrive in waves, that is the difference between continuous operation and genuine usage-based billing.
What these cases have in common: none of them would have shown up as a finding in a cost tool. A tool sees a busy database and recommends a reservation for it. That the load itself is unnecessary is visible only to someone who understands the system. This is the point where cost work turns from configuration maintenance into engineering, and the reason it cannot be fully automated. Why such items so rarely sit where you look for them is something I covered in more detail in Bad architecture sends no alerts.
Result for the phase: around 800 euros a month, the smallest item on the list, but the one with the biggest operational side effect: a system with less background noise.
What this project did not have, and what still belongs on your checklist
These two accounts had barely any classic EC2. Most grown accounts I see do, and that is where the classics sit that were missing here. For completeness, because this article is meant to be a guide and not just a case story:
- Orphaned EBS volumes and snapshots. When instances are terminated, volumes survive if
DeleteOnTerminationwas not set. They keep costing, for years.
# EBS volumes not attached to any instance
aws ec2 describe-volumes \
  --filters Name=status,Values=available \
--query 'Volumes[].[VolumeId,Size,CreateTime]' --output table- Migrate gp2 to gp3. Around 20 per cent cheaper, IOPS decoupled from size, migration without interruption via an API call. For most standard workloads there is no reason left in 2026 to run gp2.
- EC2 rightsizing and Graviton. Same logic as with task sizes above: 14 day metrics instead of gut feeling, memory needs the CloudWatch agent, shrink in steps. ARM instances bring around 20 per cent on managed services at minimal effort, and on your own workloads wherever containers are built multi-arch anyway.
- NAT gateway traffic to S3 and DynamoDB. The default path sends traffic from private subnets through the NAT gateway for money, even to AWS services in the same region. A gateway endpoint routes it internally and costs nothing. I have yet to see a grown EC2 account where
NatGateway-Byteswas not a finding:
resource "aws_vpc_endpoint" "s3" {
  vpc_id            = aws_vpc.main.id
  service_name      = "com.amazonaws.eu-central-1.s3"
  vpc_endpoint_type = "Gateway"
  route_table_ids   = aws_route_table.private[*].id
}- Traffic between availability zones costs in both directions. AZ-aware routing helps, but it conflicts with resilience: what has to be multi-zone stays multi-zone.
- Unused interface endpoints cost an hourly rate per availability zone. The maths belongs per endpoint.
- Internet egress without a delivery network: the most expensive bytes in the entire catalogue.
None of these was a large item here. On your account any one of them can be five figures a year.
Phase 6: only now, commitments, on the cleaned-up baseline
After about six months the compute load was cleaned up and stable: Athena partitioned, CloudWatch slimmed down, ECS on realistic sizes. Only then came commitments, deliberately only on the load that will certainly stay. Not on the peaks, not on anything still being rebuilt. The storage cleanup even continued afterwards, so the bill kept falling after the commitments, which is precisely what confirms the order.
A quick word on terminology, because it often gets mixed up: Savings Plans exist only for compute, meaning EC2, Fargate and Lambda. For RDS, commitments are called Reserved Instances, for DynamoDB it is Reserved Capacity. The mechanism is the same everywhere: a discount in exchange for a lock-in. All three were used here, Reserved Instances for the databases, Reserved Capacity for DynamoDB, a Compute Savings Plan for the Fargate load, each with a one year term. Three years is an eternity in this industry, and the extra discount of the longer term is a bet that nothing substantial about the architecture will change. After six months of rebuilding, I did not want to take that bet.
My rule of thumb: I commit at most 70 to 80 per cent of demonstrated baseline load, never 100 per cent. The rest stays flexible. An oversized commitment is the one cost optimization that cannot be undone.
Result: around 2,700 euros a month on the remaining load.
Governance: so it does not grow back
The most uncomfortable finding from twelve months of cost work: without countermeasures, everything grows back. The same forces that pushed the bill to 15,000 euros are still at work. Every new service brings new metrics, every new pipeline new data, every new developer sizes against fear again. So the last month was not an optimization month but a setup month:
- Tagging with enforcement. Four mandatory tags, namely team, environment, application and cost centre, enforced via tag policies and checks in the IaC pipeline. A tag that is voluntary is missing from a third of resources after six months, and then every report is worthless. Enforcement means a deployment without mandatory tags fails. In my projects so far, voluntary tagging has not worked reliably in the long run.
- Budgets with alerts per account and environment, not just for the overall account. What matters is not the absolute amount but the deviation from the expected trajectory. A budget that only raises the alarm at month end is an obituary.
- Anomaly detection for the cases no budget anticipates. The service is free and reports outliers per service. It does not replace analysis, but it shortens the time between "something got expensive" and "someone knows about it". The CloudWatch item from phase 2 would have surfaced months earlier with it.
- Retention as the default, not the exception. Every new log group, every new bucket gets a retention or lifecycle rule as a mandatory parameter in the IaC module. Anyone who wants to keep data indefinitely has to write it down explicitly and be able to justify it.
- Cost in everyday development. The single most effective item in the whole governance package: one cost figure per week in the team channel, broken down by application. Not as control, but as visibility. Developers make cost-aware decisions as soon as they can see the numbers at all; before that they simply have no chance to.
- Cost per business unit instead of the total. Cost per thousand requests, per customer, per import. A rising total bill with usage rising faster is success, not a crisis. Without a denominator you cannot tell the difference, and it is exactly that distinction which turns cost discussions from panic into steering.
What wasted time
For completeness, the dead ends as well. The list is shorter than the success list, but it exists.
Chasing small amounts. Somewhere in month three I spent half a day understanding a 40 euro item. The amount has been worth 40 euros every month since; the analysis was not. Since then a hard threshold applies: anything below a defined monthly amount is not investigated while something larger is still open. The Pareto distribution on AWS bills is brutal, and the ten largest usage types here explained over 80 per cent of the total.
Evaluating tools instead of writing queries. There is a whole market of cost optimization tools and I looked at two of them seriously. Both would have found what the first week of Athena found, at a price of several per cent of the saving, permanently. For corporations with hundreds of accounts the maths may work out differently. For two accounts of this size, the CUR plus an afternoon of SQL is the better deal. The uncomfortable truth about these tools: finding is not the problem. Changing is the problem, and no dashboard does that for you.
Discussing architecture rebuilds too early. In week two there was a long debate about whether part of the system should be rebuilt. In hindsight that was procrastination at a high level: phases 1 to 3 required not a single architectural decision and delivered the bulk of the total saving. The rebuild discussion was considerably shorter months later, because by then there was data instead of opinions.
How this works alongside the day job
Twelve months sounds long. In fact it was not a full-time project but a rhythm: one measure per week, each with the same routine, namely implement, observe for a week, note the result, next. The rhythm had two effects I had not expected.
First, it makes the project interruptible. There were weeks when nothing happened because something more important came up. That cost nothing but time, with no half-finished rebuilds and no state you have to understand again first. Cost work always competes with feature work, and it rightly loses that conflict when it behaves like a major project. As a weekly rhythm it does not lose it, because it never gets big enough to be in the way.
Second, it produces a track record. After three months a document said: measure, expected saving, actual saving. That list ended more discussions than any argument. Nobody argues with "I have saved several thousand euros a month with seven measures, here are the next five".
The balance sheet, and the honest footnotes
| Measure | Saving per month (approx.) |
|---|---|
| Phase 1: deleting, capping retention | 1,200 € |
| Phase 2: observability, CloudWatch metrics | 1,800 € |
| Phase 3: data, Athena partitioning, S3 lifecycle | 4,000 € |
| Phase 4: rightsizing, Lambda memory, Fargate Spot | 2,000 € |
| Phase 5: architecture, scheduler, caching, events | 800 € |
| Phase 6: commitments on the cleaned-up baseline | 2,700 € |
| Total | ~12,500 € |
From around 15,000 to around 2,500 euros, so a good 83 per cent. The distribution is the real message of that table: the three phases without any architectural change, meaning deleting, observability and data, account for 7,000 euros, more than half. The part people picture as cost optimization, namely reservations and discounts, comes last and is not even the largest item.
Three footnotes that tend to be missing from success stories:
First: the 83 per cent are not a universal benchmark. These accounts had four years of sediment. An account someone looks at regularly might yield 20 to 30 per cent. The method transfers, the ratio does not.
Second: it took twelve months because it ran alongside the day job and because every change was observed before the next one came. You can do this in three months full time, but not in a sprint, and certainly not at the push of a button with a tool.
Third: the feature set stayed the same, but the system did not stay the same. It got simpler. That is neither coincidence nor a side effect: most cost optimizations are simplifications in disguise. Fewer unused resources, fewer special cases, fewer things that can break at night. The bill is a surprisingly good indicator of architectural quality, it is just the only one measured in euros.
What you can start tomorrow
If you have an AWS bill that nobody can explain any more:
- Enable the Cost and Usage Report and make it queryable with Athena, with resource IDs. One hour of work, the basis for everything else.
- Run the first query above and look at the fifty largest usage types, not the largest services.
- Look for orphaned resources: log groups without retention, volumes without an instance, snapshots without a volume, aborted multipart uploads. That is the part with results the same day.
- Break down the cost of observability. If CloudWatch is in your top five, there is a good chance a four figure annual amount is sitting there in metrics nobody reads.
- Check
NatGateway-Bytes. If there is a meaningful amount there and S3 or DynamoDB is involved: gateway endpoint. Free, twenty minutes. - Do not sign any commitments before points 1 to 5 are done.
And if you run into the question of whether a thorough analysis is worth it for your account: for anything above a few thousand euros a month, in my experience the answer is yes. The only question is whether the saving turns out to be four or five figures a year.
If you have to argue the approach inside your own company, to Finance or Leadership, the case is set out in the paper Usage Before Rate (PDF, CC BY 4.0): why commitments come last, which figures carry the baseline, and which controls stop the bill from growing back.
